TSLA393.450-31.85%
GM76.0000.48%
F13.350-0.29%
RIVN18.6301.45%
CYD43.390-2.9%
HMC28.0200.76%
TM174.5904.93%
CVNA68.5900.72%
PAG179.4202.34%
LAD306.23015.93%
AN186.4102.08%
GPI288.3901.79%
ABG205.4007.38%
SAH83.7300.68%
TSLA393.450-31.85%
GM76.0000.48%
F13.350-0.29%
RIVN18.6301.45%
CYD43.390-2.9%
HMC28.0200.76%
TM174.5904.93%
CVNA68.5900.72%
PAG179.4202.34%
LAD306.23015.93%
AN186.4102.08%
GPI288.3901.79%
ABG205.4007.38%
SAH83.7300.68%
TSLA393.450-31.85%
GM76.0000.48%
F13.350-0.29%
RIVN18.6301.45%
CYD43.390-2.9%
HMC28.0200.76%
TM174.5904.93%
CVNA68.5900.72%
PAG179.4202.34%
LAD306.23015.93%
AN186.4102.08%
GPI288.3901.79%
ABG205.4007.38%
SAH83.7300.68%

U.S. light vehicles fall 4% in January amid incentive changes

According to the latest NADA Market Beat report, January 2026 SAAR fell to 14.85M units.

U.S. light vehicles fall 4% in January amid incentive changes

On the Dash:

  • Dealers face lower sales volumes and reduced foot traffic due to seasonal disruptions and overall market softness.
  • Rising incentive rates provide opportunities for dealers to stimulate demand while balancing margins.
  • Inventory constraints and shifting EV/hybrid market shares require dealers to strategically manage allocation and customer demand.

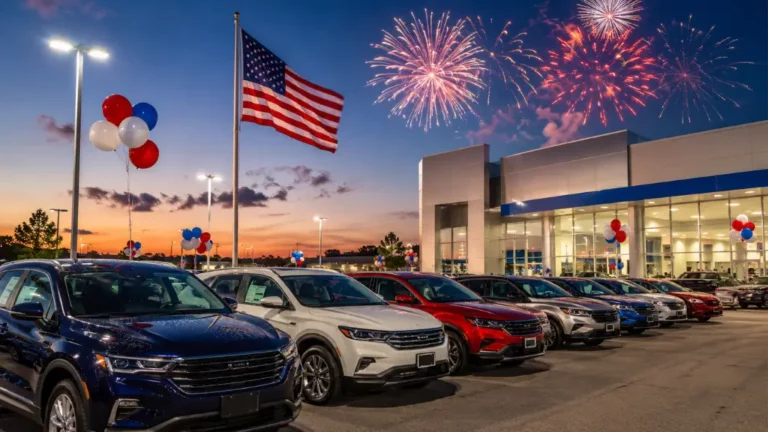
In the latest NADA Market Beat report, new-light vehicle sales in January hit a seasonally adjusted annual rate (SAAR) of 14.85 million units, down 4.1% year-over-year and the lowest monthly SAAR since January 2024. Severe winter storms in the latter half of the month disrupted dealer traffic and sales in affected regions.

Average incentive spending rose 5.6% from January 2025 to $3,335 per unit but fell 5.5% compared to December 2025. As a percentage of MSRP, incentives averaged 6.6%, well below pre-pandemic levels near 10%, suggesting dealers and automakers have room to increase discounts to stimulate demand.

Sign up for CBT News’ daily newsletter and get the latest industry stories delivered straight to your inbox. 

Battery electric vehicle (BEV) market share fell to 6.6%, a 1.9 percentage-point decline from January 2025, reflecting the absence of federal EV tax credits. Conventional hybrids performed strongly, capturing 12.6% of the market, up 0.5 percentage points from a year earlier.

Inventory at the end of January totaled 2.53 million new light vehicles, down 9.2% year-over-year and 2% from December 2025. Dealers can expect inventory to remain between 2.5 million and 2.6 million units through the first half of 2026 before increasing later in the year.

More from Market Reports
EV

Ford Q2 sales fall 10.3% as EVs and F-Series weigh on results

- July 3, 2026
On the Dash: Ford sold 549,200 vehicles in Q2, down 10.3% year-over-year, slightly better than Cox Automotive's projection of an 11.5% decline. Pure EV sales fell 40.7%, while F-Series sales...

GM tops US sales in Q2 despite 33% drop in EV sales

- July 2, 2026
On the Dash: GM sold 714,896 vehicles in Q2, the most of any automaker, despite a 4.2% year-over-year drop. Hyundai-Kia and Honda both moved up a spot from Q1,...
Nissan

Nissan reports 16 straight months of retail sales growth

- July 2, 2026
On the Dash: Nissan Group reported second-quarter U.S. total sales of 242,741 units, up 9.6% year-over-year, with Nissan Division retail sales increasing 8.8% for the quarter. Frontier, Sentra, and Rogue...
Hybrid demand lifts Toyota, Hyundai, Subaru and Kia in June

Hybrid demand lifts Toyota, Hyundai, Subaru and Kia in June

- July 1, 2026
On the Dash: Toyota, Hyundai, Subaru and Kia each posted double-digit percentage sales gains in June 2026. Hyundai and Kia set all-time records for June, the quarter and the first...
CBT News
Privacy Overview

This website uses cookies so that we can provide you with the best user experience possible. Cookie information is stored in your browser and performs functions such as recognising you when you return to our website and helping our team to understand which sections of the website you find most interesting and useful.