- New-vehicle ATP fell to $49,220 in May, the smallest year-over-year gain of 2026.
- Subcompact and compact SUV segments hit all-time highs; EV prices fell for the 11th straight month.
- Incentive spending rose to 7.1% of ATP, with EV incentives running at nearly twice the industry average.
New-vehicle prices eased in May after a stronger April. The average transaction price (ATP) fell to $49,220, down 0.5% from April but still up 1.2% from a year ago, according to the latest data from Kelley Blue Book. That annual gain is the smallest of 2026 and well below the long-term May average of 3.5%.
SUVs lead price gains
Midsize SUVs, compact SUVs, and full-size pickups again led sales volume. Those three segments, along with subcompact SUVs and compact cars, accounted for 64.2% of total industry sales. The midsize SUV segment topped volume rankings for the fourth consecutive month.
Prices for subcompact and compact SUVs reached all-time highs in May. The ATP for compact SUVs reached $37,757, up 0.7% from April and up 3.4% compared to last year. Subcompact SUV prices hit $31,122, a 1.1% increase from last month and up 4.2% year over year.
Subcompact cars posted the largest increase of any segment, up 21.8% year over year to $30,490, while sports cars saw the steepest decline, falling 14.3% year over year to $44,849.
Breakdown by brand
Results varied by manufacturer:
- Hyundai Motor Group posted the strongest year-over-year gain among major OEMs, with ATP rising 5.3% to $39,228
- Kia led individual brands, up 9.1% to $39,160
- Buick climbed 10.1% to $38,185
- Infiniti rose 8.6% to $72,614
- Toyota gained 3.7% year over year to $46,686, with the brand rising 4.2% to $44,219
- Ford posted a 3.8% year-over-year gain to $57,188, as the brand slipped 2.0% month over month to $56,316
- Lincoln rose 7.1% year over year to $74,301
- General Motors was essentially flat year over year, with ATP edging down 0.1% to $54,003
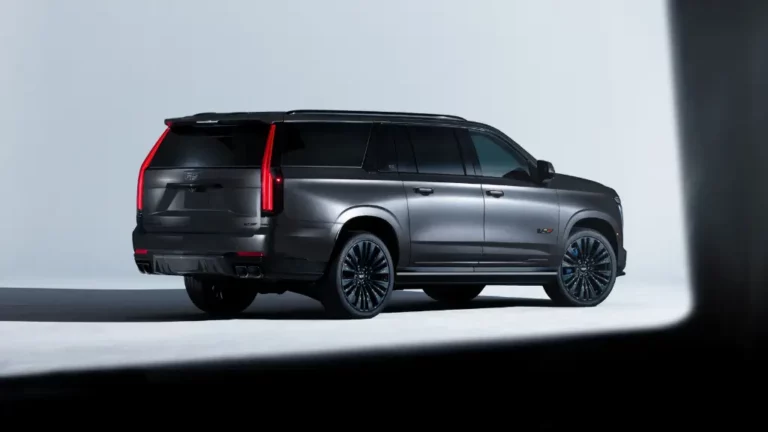
- Cadillac rose 5.8% to $84,650
- Chevrolet declined 1.2% to $48,884
Notably, several brands saw year-over-year declines:
- Volkswagen fell 5.0% to $57,405
- Mercedes-Benz dropped 2.5% to $72,763
- Acura slipped 2.7% to $49,531
What’s driving new vehicle prices
Redesigned models are pushing prices higher in key segments. New SUV launches and supply constraints are the primary factors, according to Cox Automotive.
“Average transaction prices are rising 2–4% year over year across key vehicle segments, powered by a convergence of product cycles and supply dynamics: Redesigned SUVs from Toyota, Kia, Jeep, and Hyundai are commanding higher prices out of the gate, while Ford’s F-Series production constraints are tightening truck inventory, lifting average transaction prices, with freshened Ram pickup stepping in to capture buyers at the premium end,” said Erin Keating, Executive Analyst at Cox Automotive, in the report.
EV prices fall for 11th straight month
Electric vehicle transaction prices fell again in May, with the average EV ATP dropping to $54,532, down 4.0% year over year. Additionally, May marked the 11th consecutive month of annual EV price declines. However, EV incentive spending held steady at 14% of ATP, or roughly $7,600 per vehicle. That is nearly twice the industry average.
Tesla remains the dominant EV brand by sales volume. Its ATP fell 3.4% year over year to $52,759, down 1.0% from April. The Model 3 averaged $49,082, and the Model Y averaged $51,537, accounting for 96% of Tesla’s total sales in May.
Initial estimates put total EV sales above 85,000 in May, the best monthly result since federal tax credits were revoked at the end of Q3 2025.
Moreover, incentive spending rose to 7.1% of ATP in May, up from 6.9% in April and 6.8% a year ago. Spending remained highest for EVs, many luxury segments, compact cars, and full-size pickups. Automakers have kept incentive spending relatively steady since January 2024. The two-year average sits at 6.9% of ATP.
What to watch
Dealers will want to monitor segment-level pricing as the summer sales season gets underway. Affordable SUV segments are showing the strongest price momentum. Incentive spending remains disciplined industry-wide, but EV lots continue to carry the heaviest discount burden.
Dealers should watch inventory levels closely in the full-size truck segment. F-Series supply constraints are already lifting ATPs, and any further tightening could shift buyers toward Ram and other alternatives at the premium end.