Cleveland, OH – According to figures released today by the Greater Cleveland Automobile Dealers’ Association (GCADA), a total of 19,398 new vehicles were registered in May, a difference of .19 percent compared to the 18,890 sales in the same month last year. Year to date sales figures were up by 6.81 percent over last year.
“Last month’s new vehicle sales align almost exactly with May of 2024 as the market settles into a more consistent pace, after numerous administrative uncertainties,” says Louis A. Vitantonio, president of the GCADA. “Used vehicle sales are still struggling, given higher wholesale costs with less inventory available.”
Used vehicle sales totaled 18,170 in the month of May, a decrease of 4.58 percent compared to the same month last year, and down by 5.72 percent year over year.
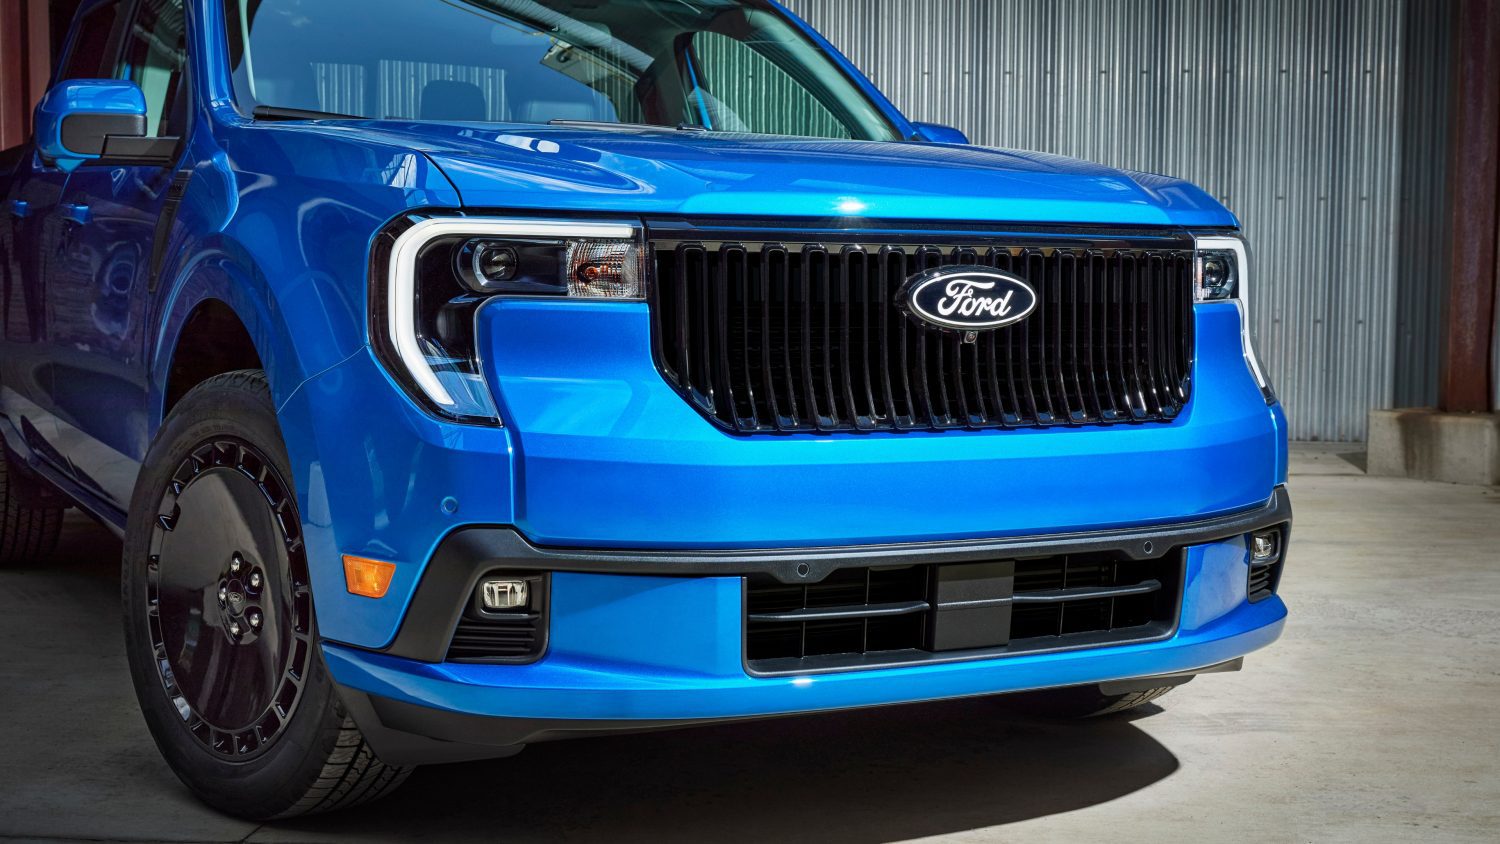
Northern Ohio’s top five best-selling brands also remain consistent, with Chevrolet in the top spot recording 2,597 sales in May. Ford holds onto second with 2,410 new vehicles sold in the month. Honda’s sales of 1,851 vehicles kept the brand in third, while Kia and Toyota followed with 1,718 and 1,626 sales, respectively.
New-car and truck sales in Northern Ohio
May ‘25 / May ‘24 & YTD
|
|
May ‘25 |
May ‘24 |
YTD |
YTD |
|
YTD |
|
ACURA |
133 |
128 |
527 |
574 |
3.91% |
-8.19% |
|
ALFA ROMEO |
5 |
18 |
53 |
101 |
-72.22% |
-47.52% |
|
ASTON MARTIN |
1 |
0 |
6 |
7 |
0.00% |
-14.29% |
|
AUDI |
78 |
116 |
537 |
603 |
-32.76% |
-10.95% |
|
BENTLEY |
2 |
3 |
12 |
15 |
-33.33% |
-20.00% |
|
BMW |
205 |
250 |
1138 |
1142 |
-18.00% |
-0.35% |
|
BUICK |
642 |
646 |
3382 |
2761 |
-0.62% |
22.49% |
|
CADILLAC |
306 |
257 |
1413 |
1126 |
19.07% |
25.49% |
|
CHEVROLET |
2597 |
2891 |
13,855 |
12,631 |
-10.17% |
9.69% |
|
CHRYSLER |
64 |
67 |
464 |
353 |
-4.48% |
31.44% |
|
DODGE |
130 |
225 |
619 |
866 |
-42.22% |
-28.52% |
|
FIAT |
2 |
0 |
18 |
1 |
0.00% |
1700.00% |
|
FORD |
2410 |
2252 |
11,389 |
11,352 |
7.02% |
0.33% |
|
FREIGHTLINER |
92 |
48 |
526 |
331 |
91.67% |
58.91% |
|
GENESIS |
90 |
74 |
392 |
338 |
21.62% |
15.98% |
|
GMC |
702 |
677 |
3557 |
3016 |
3.69% |
17.94% |
|
HINO |
2 |
1 |
7 |
7 |
100.00% |
0.00% |
|
HONDA |
1851 |
1880 |
8899 |
8512 |
-1.54% |
4.55% |
|
HYUNDAI |
1023 |
1046 |
4994 |
4983 |
-2.20% |
0.22% |
|
INFINITI |
53 |
22 |
170 |
119 |
140.91% |
42.86% |
|
INTERNATIONAL |
33 |
36 |
209 |
197 |
-8.33% |
6.09% |
|
ISUZU |
21 |
18 |
71 |
82 |
16.67% |
-13.41% |
|
JAGUAR |
4 |
8 |
28 |
52 |
-50.00% |
-46.15% |
|
JEEP |
907 |
943 |
4796 |
4570 |
-3.82% |
4.95% |
|
KENWORTH |
31 |
28 |
204 |
196 |
10.71% |
4.08% |
|
KIA |
1718 |
1374 |
8100 |
6611 |
25.04% |
22.52% |
|
LAND ROVER |
51 |
56 |
305 |
286 |
-8.93% |
6.64% |
|
LEXUS |
290 |
231 |
1157 |
994 |
25.54% |
16.40% |
|
LINCOLN |
230 |
164 |
969 |
774 |
40.24% |
25.19% |
|
MACK |
14 |
15 |
86 |
72 |
-6.67% |
19.44% |
|
MASERATI |
2 |
1 |
6 |
27 |
100.00% |
-77.78% |
|
MAZDA |
472 |
574 |
2478 |
2502 |
-17.77% |
-0.96% |
|
MERCEDES BENZ |
237 |
251 |
1276 |
1177 |
-5.58% |
8.41% |
|
MINI |
21 |
14 |
103 |
75 |
50.00% |
37.33% |
|
MISCELLANEOUS |
8 |
13 |
28 |
65 |
-38.46% |
-56.92% |
|
MITSUBISHI |
99 |
96 |
537 |
512 |
3.13% |
4.88% |
|
NISSAN |
633 |
670 |
3041 |
3175 |
-5.52% |
-4.22% |
|
PETERBILT |
89 |
127 |
471 |
414 |
-29.92% |
13.77% |
|
PORSCHE |
63 |
46 |
292 |
212 |
36.96% |
37.74% |
|
RAM |
678 |
472 |
3663 |
2935 |
43.64% |
24.80% |
|
ROLLS-ROYCE |
2 |
4 |
6 |
10 |
-50.00% |
-40.00% |
|
SUBARU |
1036 |
1169 |
5698 |
5486 |
-11.38% |
3.86% |
|
TESLA |
214 |
292 |
1126 |
1356 |
-26.71% |
-16.96% |
|
TOYOTA |
1626 |
1586 |
7268 |
7187 |
2.52% |
1.13% |
|
VOLKSWAGEN |
418 |
523 |
2315 |
2278 |
-20.08% |
1.62% |
|
VOLVO |
107 |
114 |
516 |
437 |
-6.14% |
18.08% |
|
WESTERN STAR |
6 |
8 |
34 |
56 |
-25.00% |
-39.29% |
|
Total Cars and Trucks |
19,398 |
19,434 |
96,741 |
90,576 |
-0.19% |
6.81% |
Retail sales figures are based on vehicle registration reports from the Ohio Bureau of Motor Vehicles. Vehicle sales data includes all dealers in these 21 counties: Ashland, Ashtabula, Carroll, Columbiana, Coshocton, Cuyahoga, Erie, Geauga, Holmes, Huron, Lake, Lorain, Mahoning, Medina, Portage, Richland, Stark, Summit, Trumbull, Tuscarawas and Wayne.
About the GCADA
The Greater Cleveland Automobile Dealers’ Association (GCADA) has served the retail automobile industry and community with integrity and distinction since 1915. Today, located in Broadview Heights, GCADA represents over 280 franchised motor vehicle dealers, which include new-car, truck, motorcycle and RV dealers in 32 Ohio counties along the Lake Erie shore and beyond. More information on the GCADA can be found at www.gcada.org.